
Application Developer is DC's own largest role by volume this quarter (25,299 postings, second only to LA among the 7 new metros) — and DC's employer base is broader than LA's: 5,984 companies posted for this title here, more than in any other new metro, including LA's 5,740. Across DC's ten most-hired roles, Sales Representative remains the widest band (2.06×) and Physical Therapist the tightest (1.25×).
5,984 companies posted for Application Developer in DC this quarter — more hiring companies than in any of the other 6 new metros, LA included. LA still posts more total listings for the role (29,183 vs. DC's 25,299), but DC's demand is broader: more employers are independently competing for the same title.
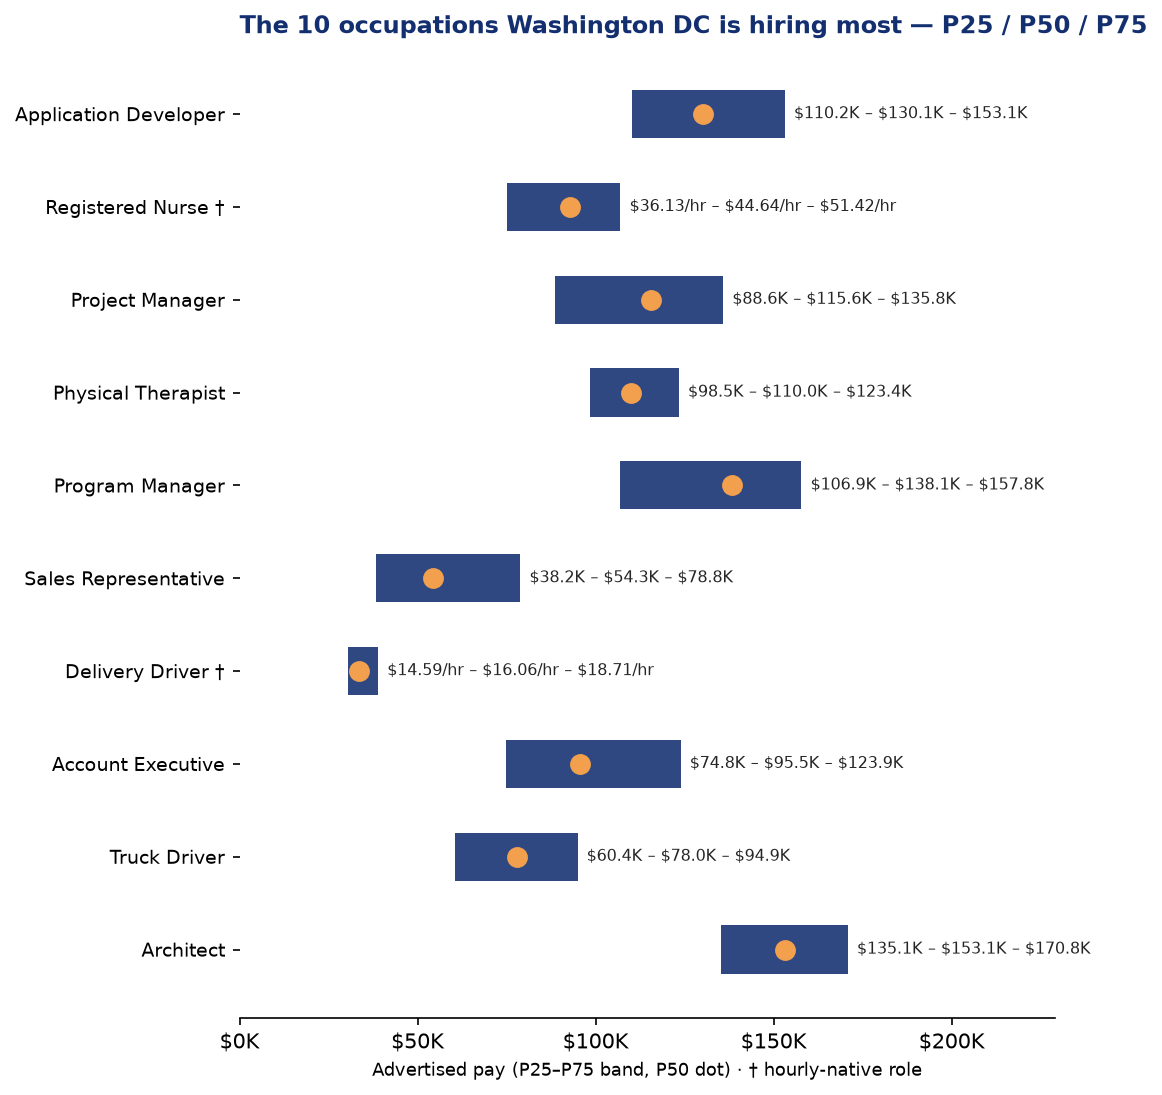
1. Application Developer: DC's demand is broad, not just deep. 5,984 hiring companies posted for this role — the most of any of the 7 new metros — even though DC's total posting count (25,299) trails LA's (29,183). $110,194.25–$153,114.00 (1.39×), DC's own largest top-10 role by volume.
2. Sales Representative: DC's widest band, $38,239–$78,835 (2.06×). One of five of the 7 new metros where this role posts the widest band of any top-10 title.
3. Physical Therapist: DC's tightest band, $98,535–$123,364 (1.25×). The market has converged on one price for this title, matching the pattern in Atlanta and Seattle.
4. Architect tops out higher here than in any other new metro. P75 $170,814.75 — the highest of the 7.
Application Developer $130.1K vs. $133.1K (−2.3%); Registered Nurse $44.64/hr vs. $45.00/hr (−0.8%); Physical Therapist $110.0K vs. $101.0K (+8.9%); Sales Representative $54.3K vs. $64.2K (−15.4%); Delivery Driver $16.06/hr vs. $20.56/hr (−21.9%); Truck Driver $78.0K vs. $58.6K (+33.1%); Architect $153.1K vs. $99.3K (+54.2% — this comparison may be misleading if DC's Architect cohort blends building and IT/solutions architects; not resolved this round). Project Manager, Program Manager and Account Executive have no BLS SOC equivalent.
WageScape/MarketTrak, advertised postings, Apr 1–Jun 30, 2026. 135,736 postings across DC's 10 highest-volume distinct roles. Every role is a P25/P50/P75 band. Registered Nurse quoted per hour; other roles annual. Aggregates only; rows publish at n≥500.
Tell us any role and any metro — we'll send you that band, free. And when you're ready: a custom report with exactly your roles × your markets, built on demand.
Tell us the role and the market — we'll send the advertised P25/P50/P75 band, checked against BLS, within 2 business days. Free for HR and comp teams.
Source: WageScape/MarketTrak, mt_1q, Apr 1–Jun 30, 2026, single quarter. Sample: 135,736 postings across DC's 10 highest-volume distinct roles. P25/P50/P75 bands throughout, never a lone median. Registered Nurse quoted per hour; other roles annual. Aggregates only; rows publish at n≥500 (smallest DC role: Architect, n=8,443).
WageScape / MarketTrak, Q2 2026 · BLS check: OEWS May 2025