
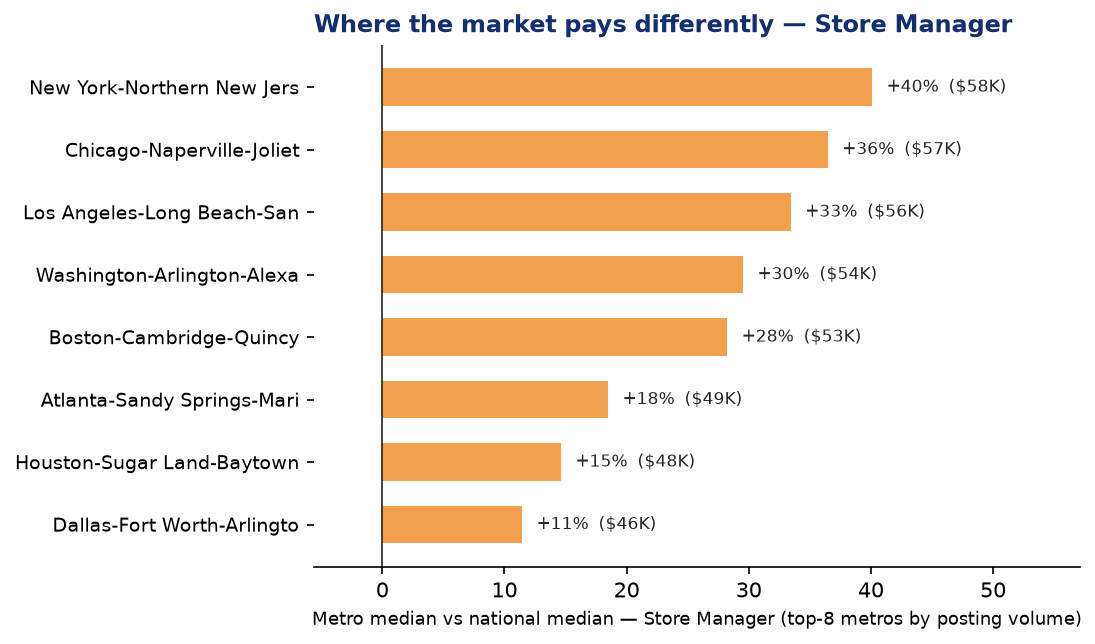
Same title, same quarter, 26% apart: the advertised Store Manager median runs $46K in Dallas–Fort Worth and $58K in New York. Frontline bands have converged (Cashier $10.25–$15.04/hr); the management ladder is where the market still disagrees. With the BLS check.
The advertised Store Manager median runs $46K in Dallas–Fort Worth and $58K in New York this quarter — a 26% gap inside one role. If your geo-differentials come from a national number, every req is mis-priced before it posts.
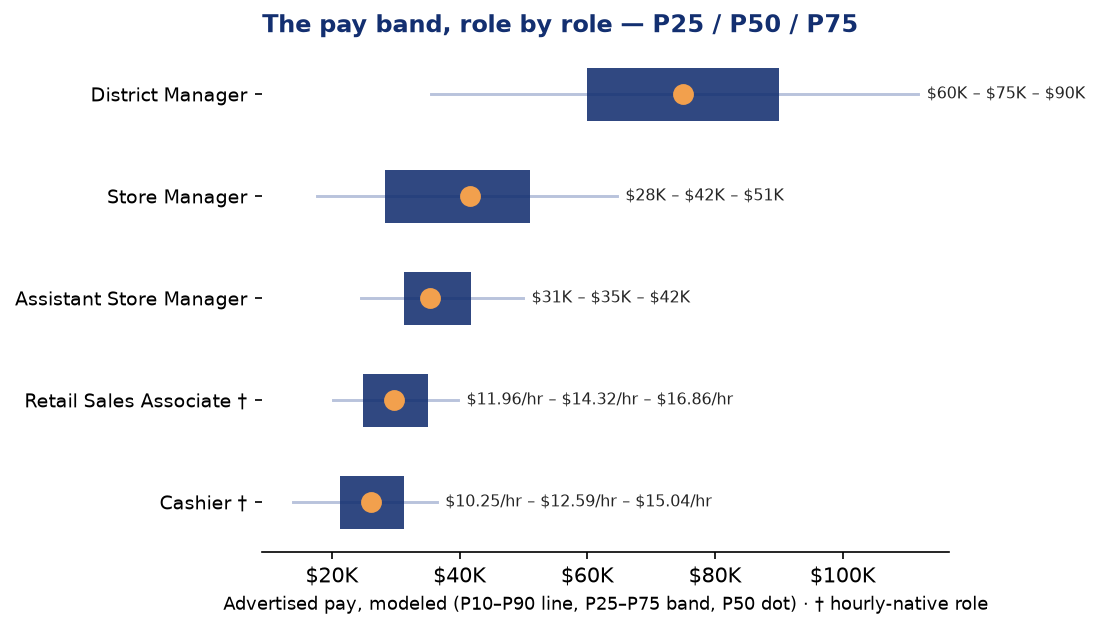
Frontline retail pay sits in tight, converged bands: Cashier $10.25–$15.04/hr (median $12.59/hr), Retail Sales Associate $11.96–$16.87/hr ($14.32/hr). These are commodity-priced markets — posting outside the band is a strategy, not noise. Above the floor the market still disagrees: Store Manager runs $28K–$51K ($42K) and District Manager $60K–$90K ($75K) — the widest bands in the sector.
Every median printed next to its government benchmark: advertised frontline postings run 12–16% below the BLS incumbent median — base starting rates, before differentials and tenure, versus an incumbent-weighted survey — and the deltas are consistent across roles. Full table in the PDF. BLS OEWS reports May 2025; these are postings from April–June 2026.
Compete for frontline talent on schedule, benefits and progression — the bands are too tight for dollars alone to differentiate. Watch the Store Manager band (1.8×, the widest in the sector): place it deliberately against your span-of-control model, and geo-differentiate it before benchmarking against competitors.
Need a band for a role or metro that isn’t in this report? Request it free — tell us the role and market and we’ll send it.
Tell us the role and the market — we'll send the advertised P25/P50/P75 band, checked against BLS, within 2 business days. Free for HR and comp teams.
Source: WageScape / MarketTrak — advertised-posting data from public job postings, April 1–June 30, 2026 (single quarter; no period-over-period claims). Sample: 1.4M postings across 5 core retail roles. Listing-weighted national figures; every role reported as a P25/P50/P75 band, never a lone median; hourly-native roles quoted per hour. Pay levels are modeled from postings; the BLS check prints each median next to the BLS OEWS benchmark (May 2025), with deltas computed from the printed values. Aggregates only. Every figure reproduces from a saved, dated query snapshot.
WageScape / MarketTrak, Q2 2026 · BLS check: OEWS May 2025