
28,882 nurse postings hit the Dallas–Fort Worth market this quarter, from ~1,672 employers. Your RN offer isn't competing with a survey median — it's competing with all of them. The 10 occupations DFW hires most, each with the BLS check.
Your RN offer in Dallas–Fort Worth isn't competing with a survey median — it's competing with all of them. The advertised RN band runs $35.70–$49.42/hr this quarter (P25–P75, median $42.29/hr). The rest of the metro's ten most-hired occupations: Truck Driver $60.3K–$91K ($73.3K), Application Developer $95K–$140K ($116K), Project Manager $82.5K–$128K ($107.3K), Physical Therapist $95K–$115K ($103K), Sales Representative $47.4K–$90K ($66.4K), and more.
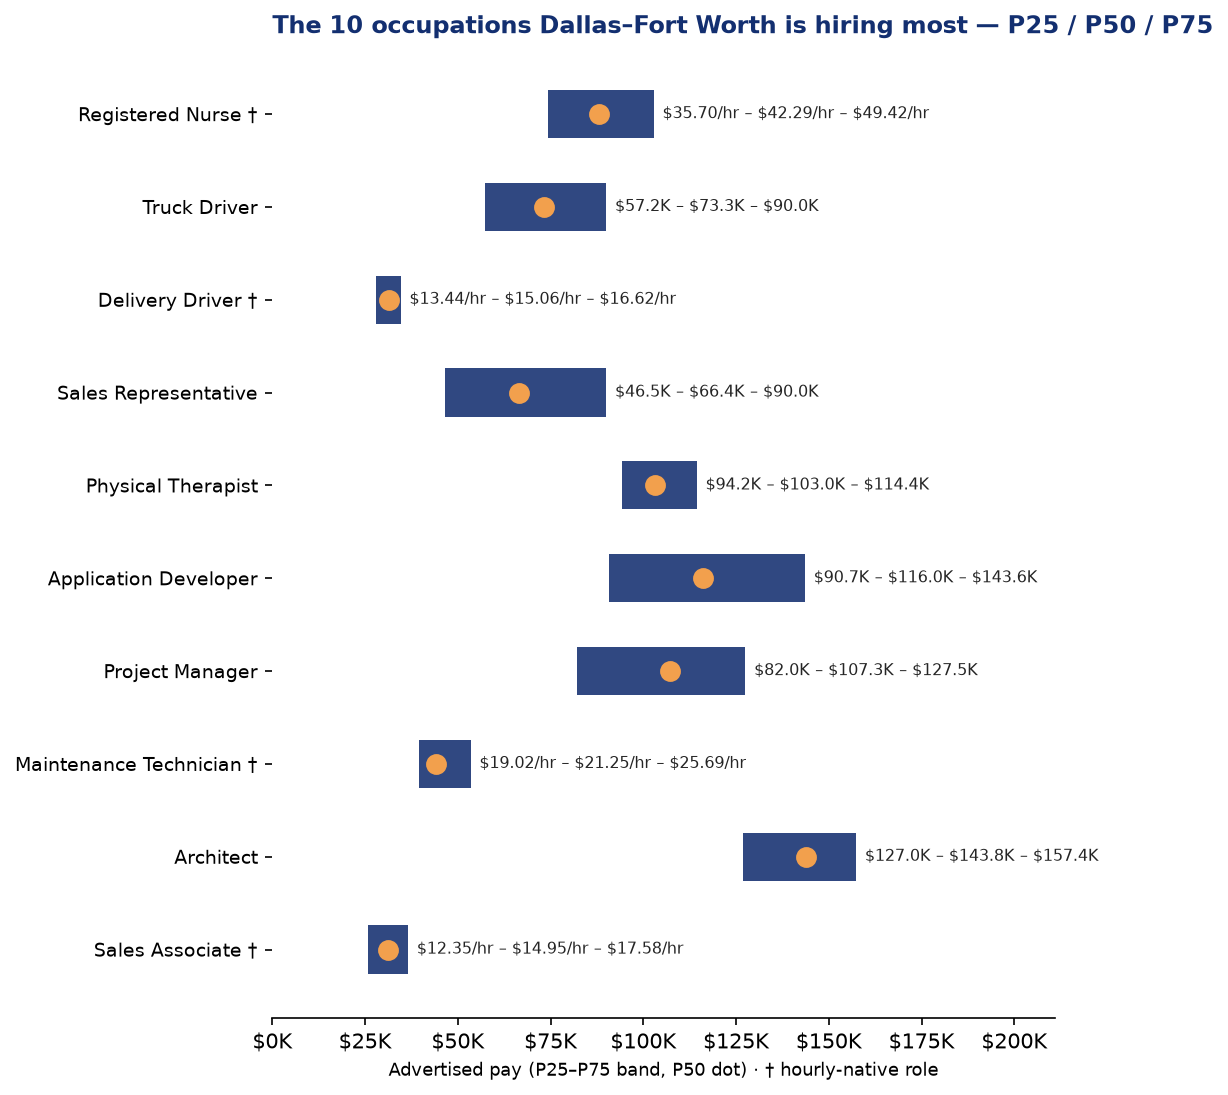
Every advertised median printed next to its government benchmark: Truck Driver +25.1% (projected gross vs base wage), Sales Representative +3.4%, RN −6.0%, Application Developer −12.8%, Delivery Driver −26.8% (gig/contract mix). The gap is information, not error. Full table in the PDF. BLS OEWS reports May 2025; these are postings from April–June 2026.
Request any role in any metro — e.g. “Pharmacy Technician, Des Moines” — and we’ll send the advertised P25/P50/P75 band, checked against BLS, within 2 business days. Free for HR and comp teams. It’s the same engine behind our custom reports: your roles × your markets, built on demand.
Tell us the role and the market — we'll send the advertised P25/P50/P75 band, checked against BLS, within 2 business days. Free for HR and comp teams.
Source: WageScape / MarketTrak — advertised-posting data from public job postings, April 1–June 30, 2026 (single quarter; no period-over-period claims). Sample: 110,640 postings across the metro's 10 highest-volume distinct occupations (vague titles excluded; overlapping title conventions consolidated to one row per occupation; rows publish only at n≥500 and above the state wage floor). Every role is a P25/P50/P75 band, never a lone median; hourly-native roles quoted per hour. Pay levels are modeled from postings; the BLS check prints each median next to the BLS OEWS benchmark with deltas computed from the printed values. Aggregates only; every figure reproduces from a saved, dated query snapshot.
WageScape / MarketTrak, Q2 2026 · BLS check: OEWS May 2025